"Functional visualizations are more than innovative statistical analyses and computational algorithms. They must make sense to the user and require a visual language system that uses colour, shape, line, hierarchy and composition to communicate clearly and appropriately, much like the alphabetic and character-based languages used worldwide between humans."
Matt Woolman - Digital Information Graphics at Visual complexity

1 comment:
"The shadow of Newfoundland lies flat and still.
Labrador's yellow, where the moony Eskimo
has oiled it. We can stroke these lovely bays,
under a glass as if they were expected to blossom,
or as if to provide a clean cage for invisible fish.
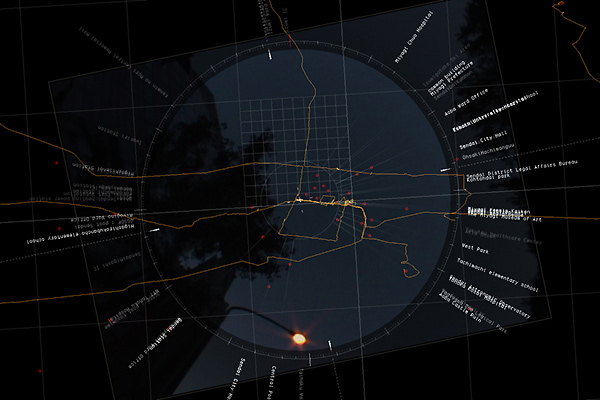
The names of seashore towns run out to sea,
the names of cities cross the neighboring mountains
-the printer here experiencing the same excitement
as when emotion too far exceeds its cause.
These peninsulas take the water between thumb and finger
like women feeling for the smoothness of yard-goods."
from The Map, by Elizabeth Bishop
Post a Comment